Visual gallery
Each static preview links conceptually to an interactive HTML file in the
figures/ directory. Download or clone the repository and open an HTML file in
a browser to use hover, zoom, selection, animation, and 3D rotation.
Differential expression
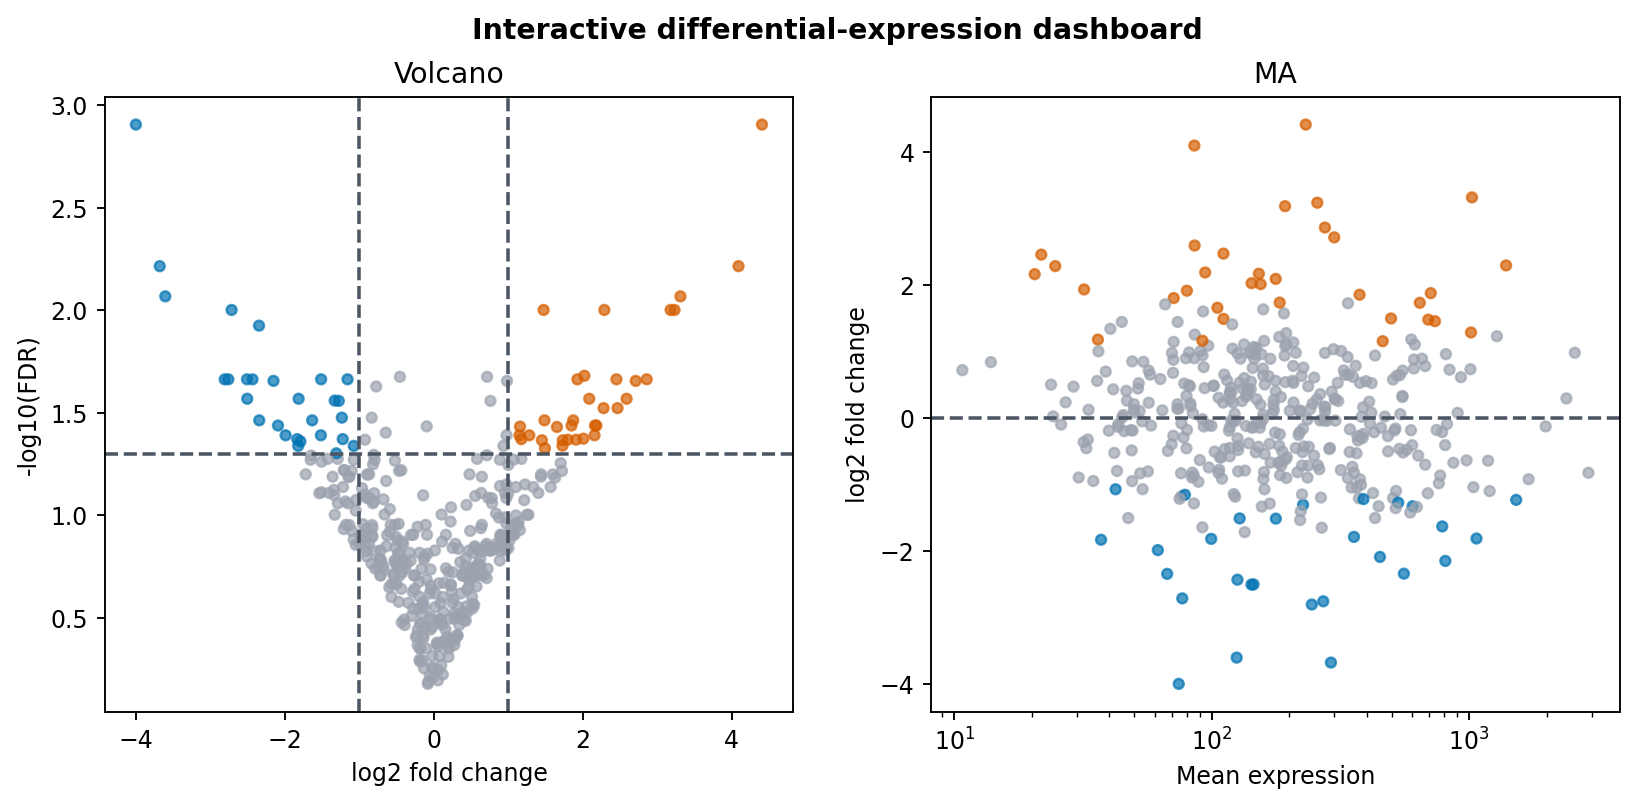
Use the two views together: the volcano plot emphasizes statistical evidence and effect size; the MA plot reveals abundance-dependent behavior.
Subject-aware time course
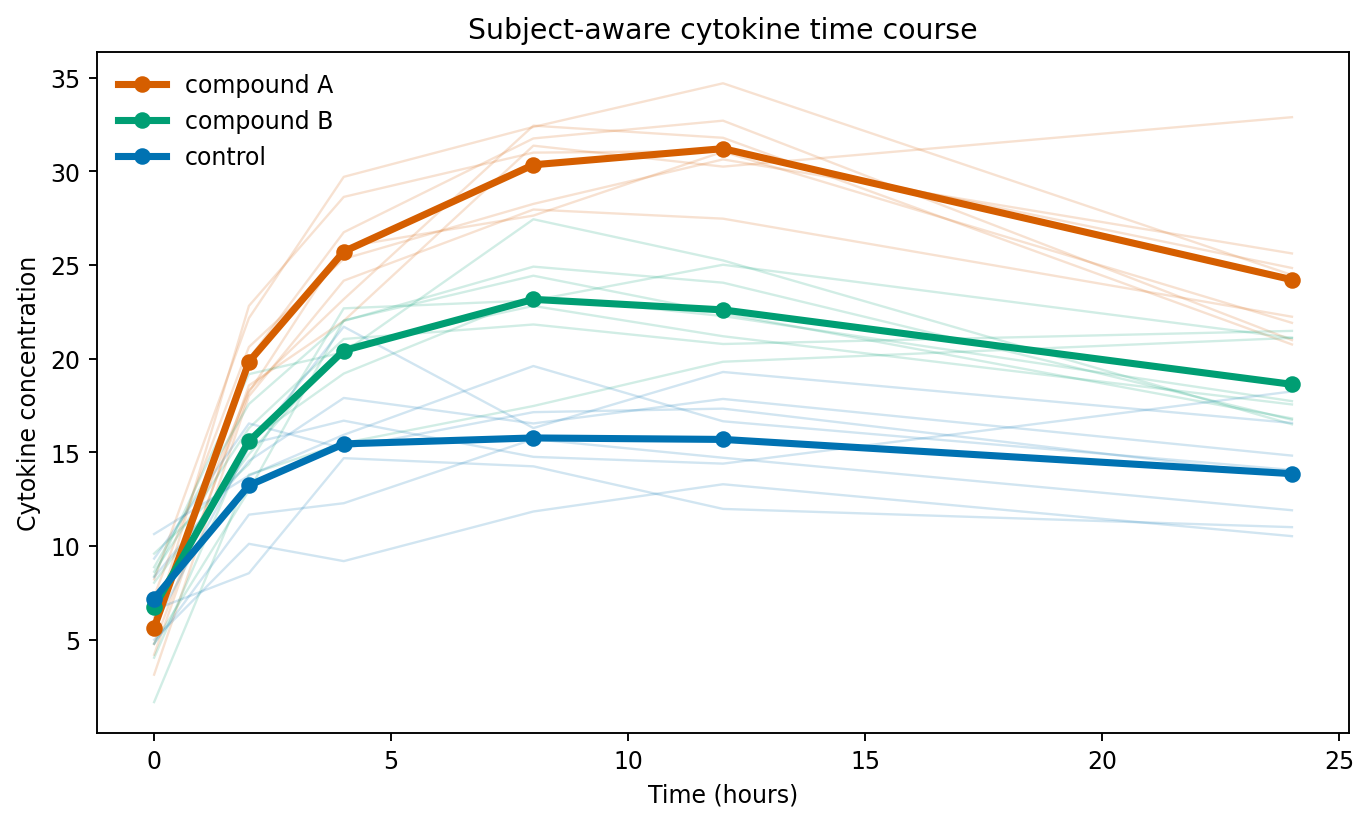
Individual subject trajectories stay visible beneath treatment means.
Microbiome composition
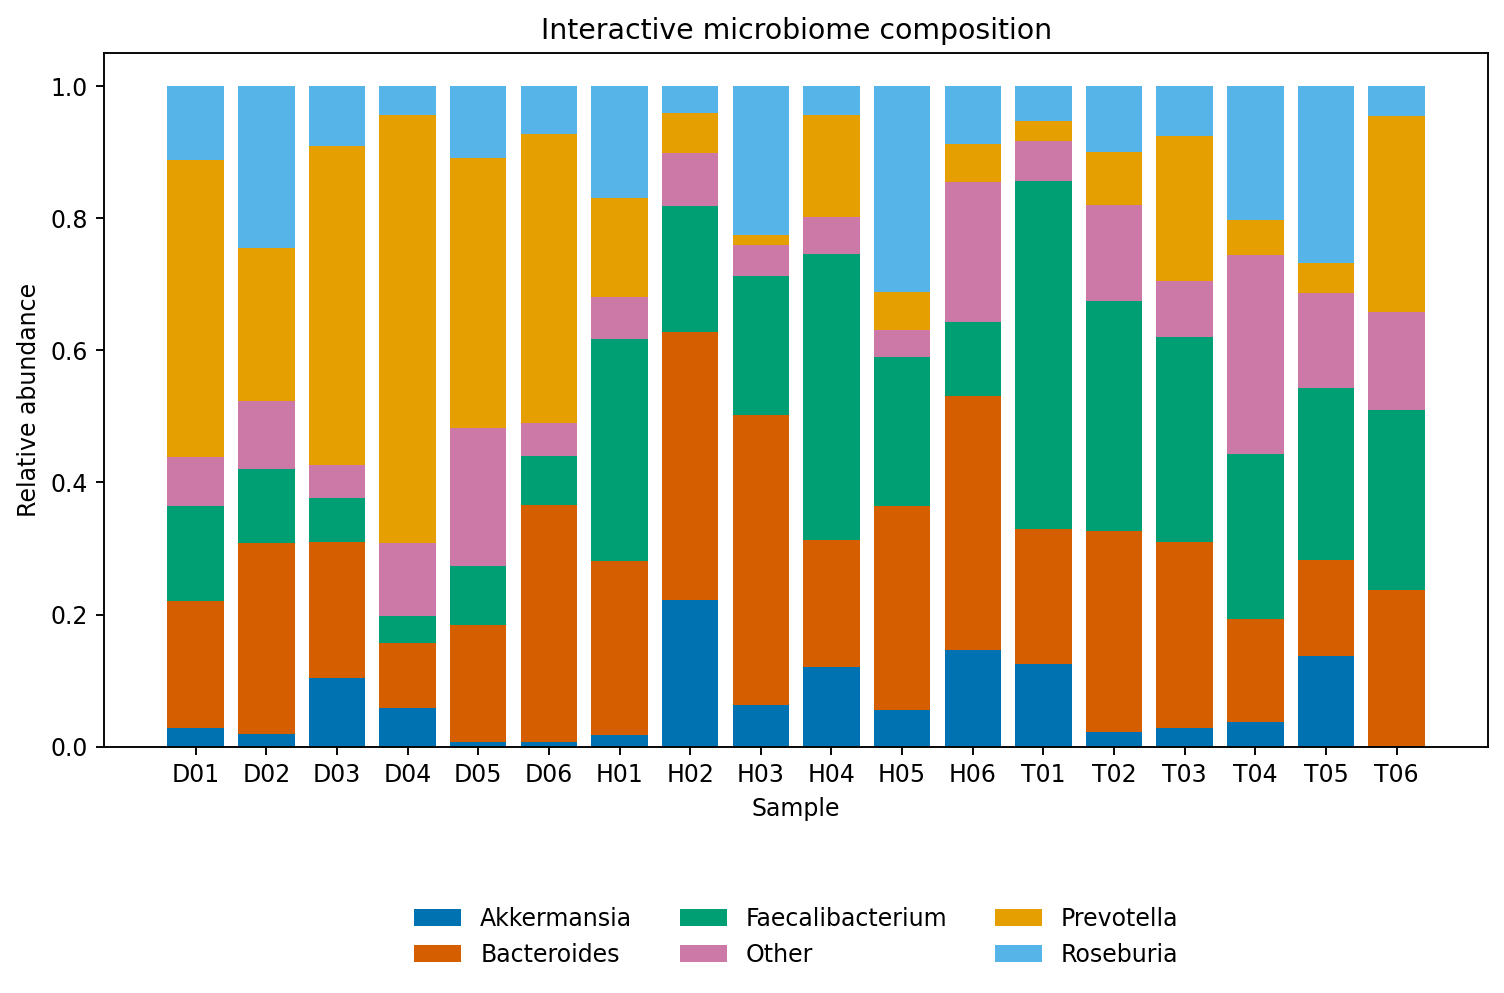
The stacked chart is descriptive. Composition-aware inference requires an explicit model and cannot be replaced by visual percentage comparison.
CLR heatmap
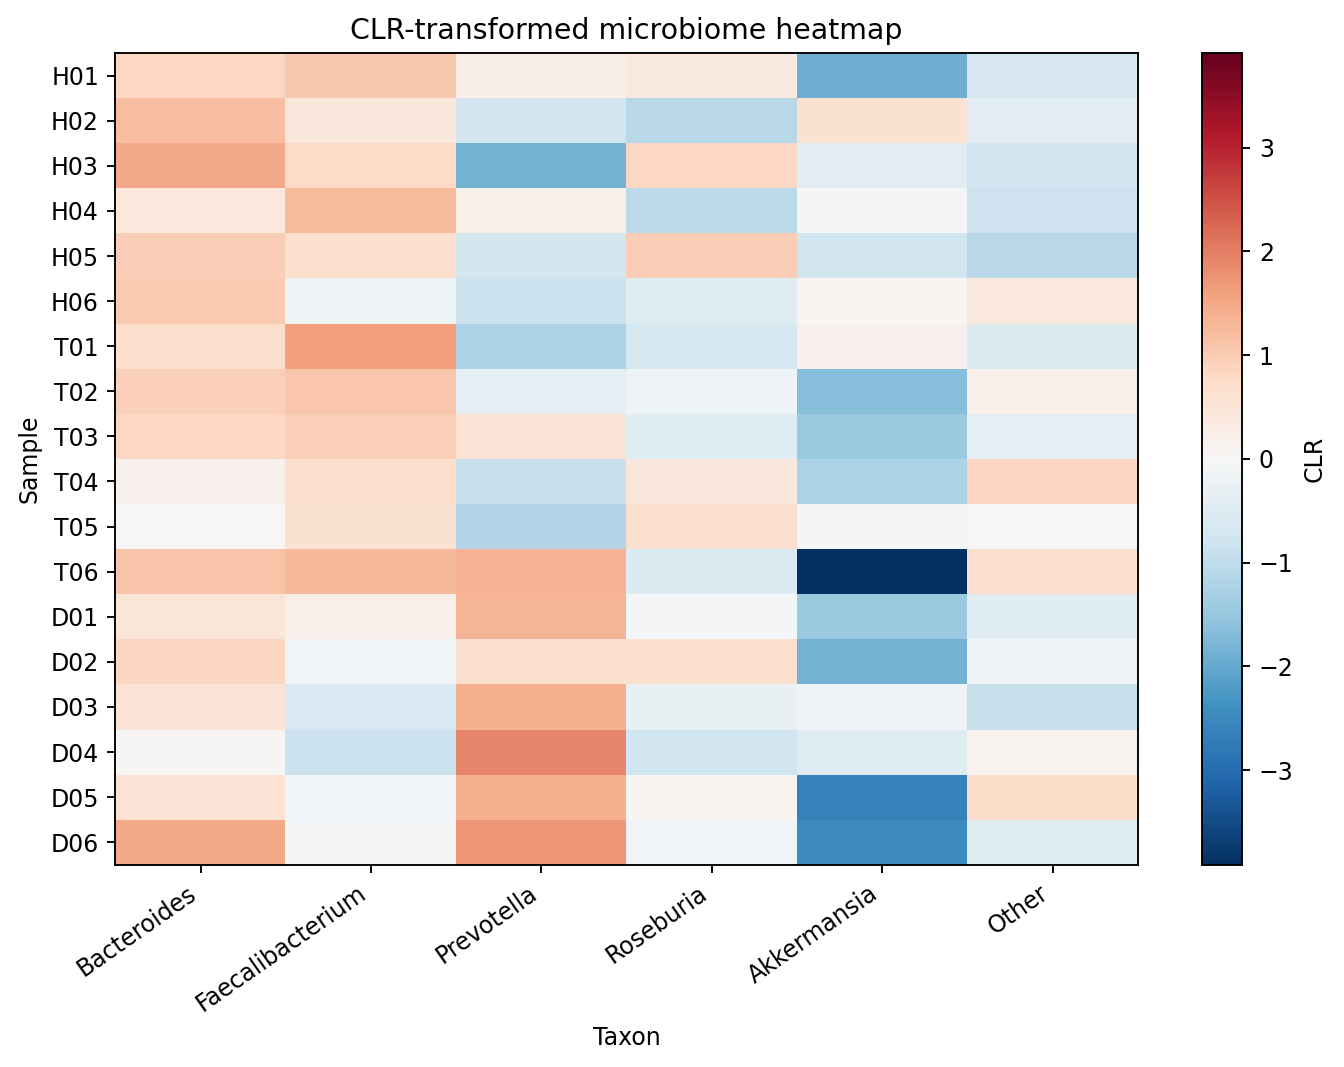
Counts receive a stated pseudocount before centered-log-ratio transformation.
Pangenome PCA
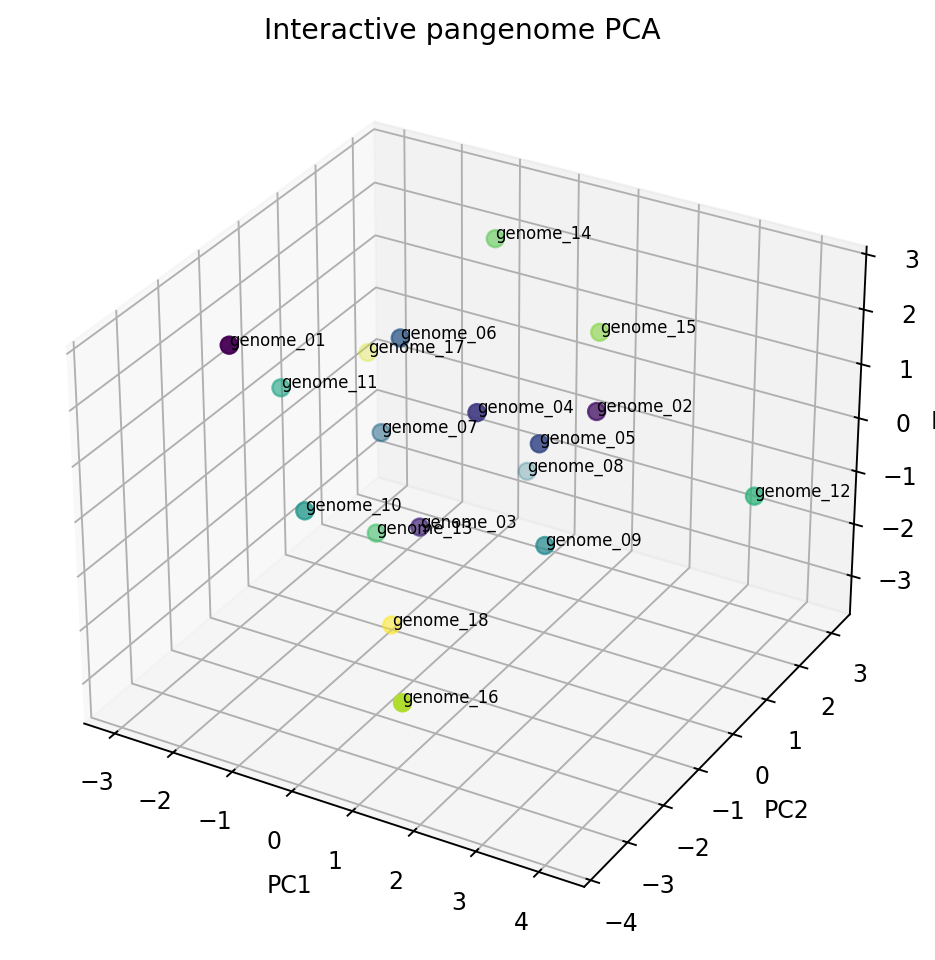
The interactive 3D projection is exploratory and retains sample identifiers in hover.
Sequencing QC
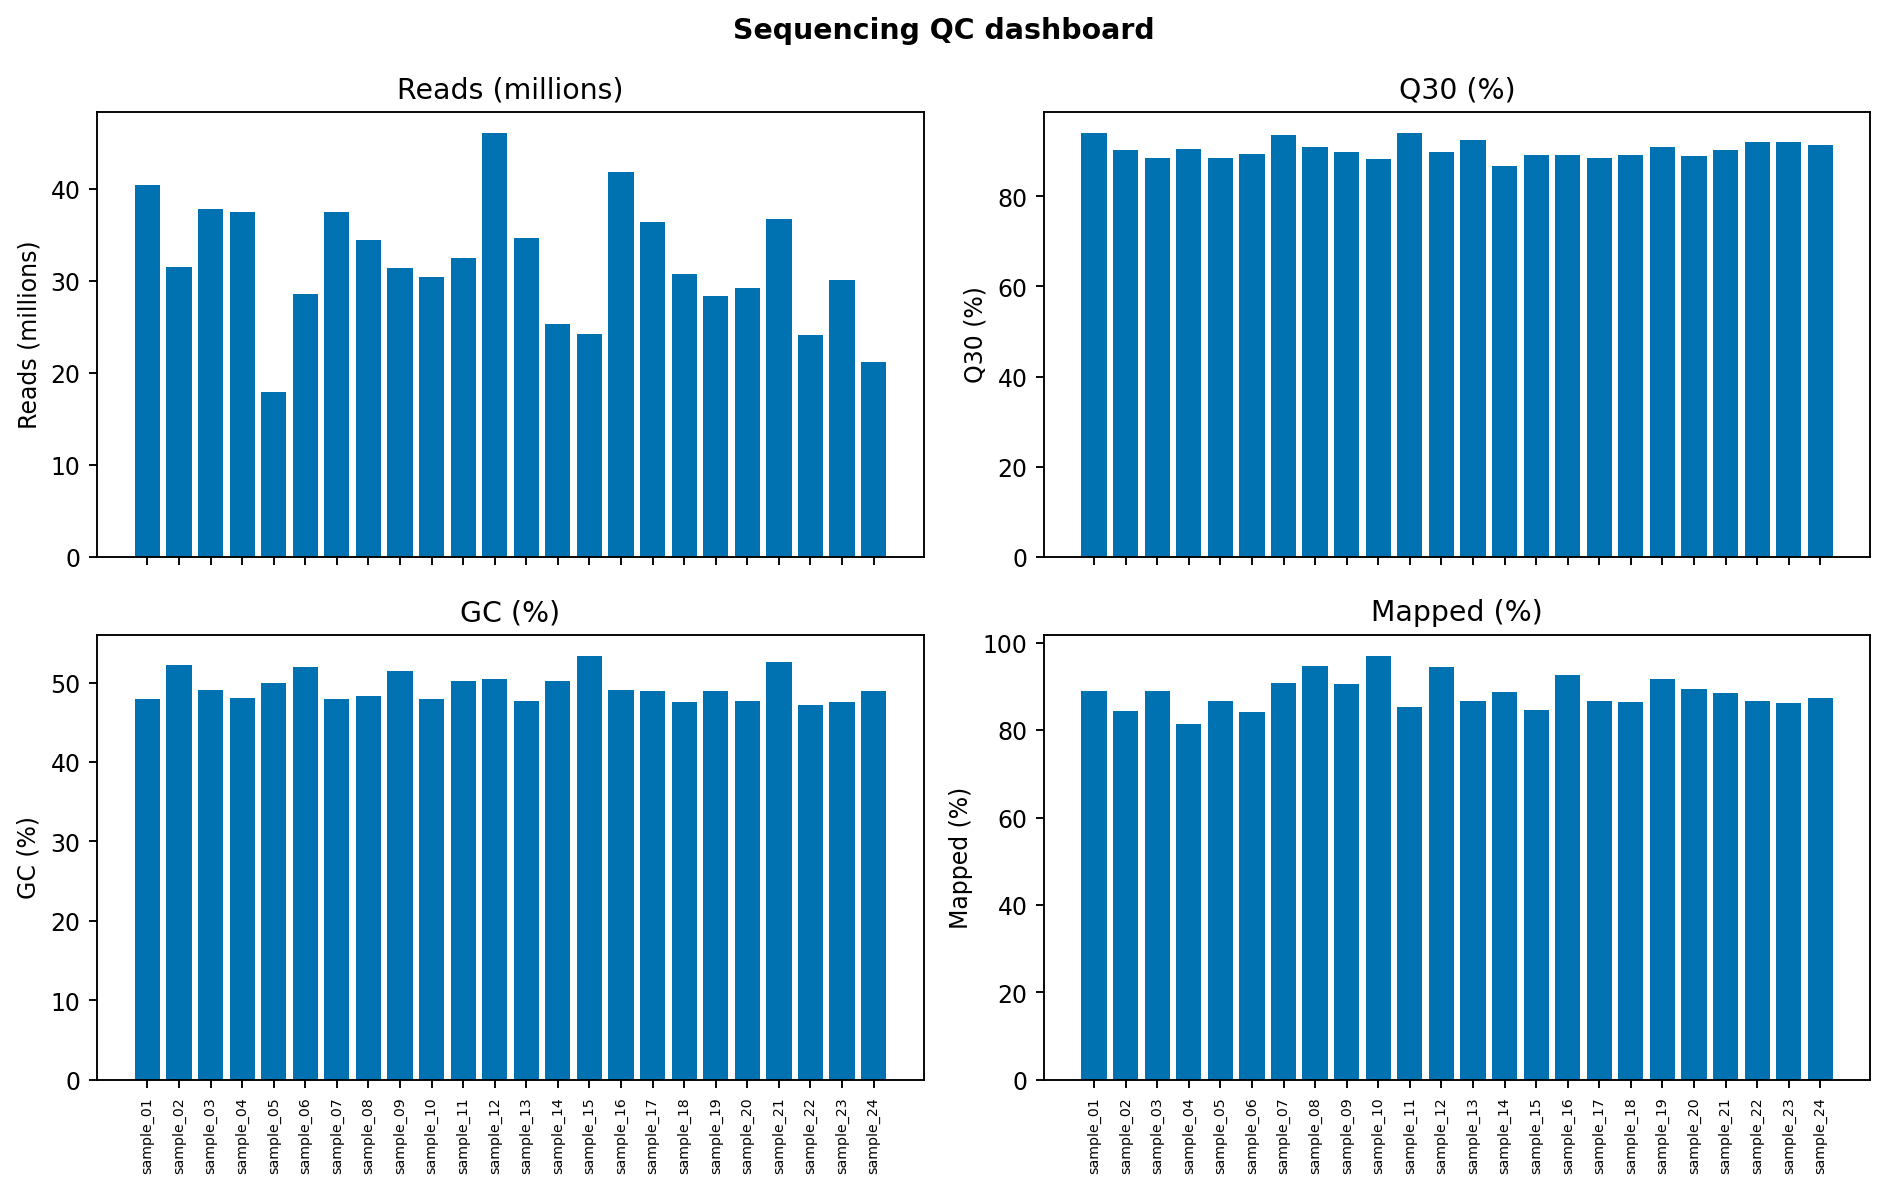
Four coordinated panels expose read depth, base quality, GC content, and mapping rate.
Manhattan plot
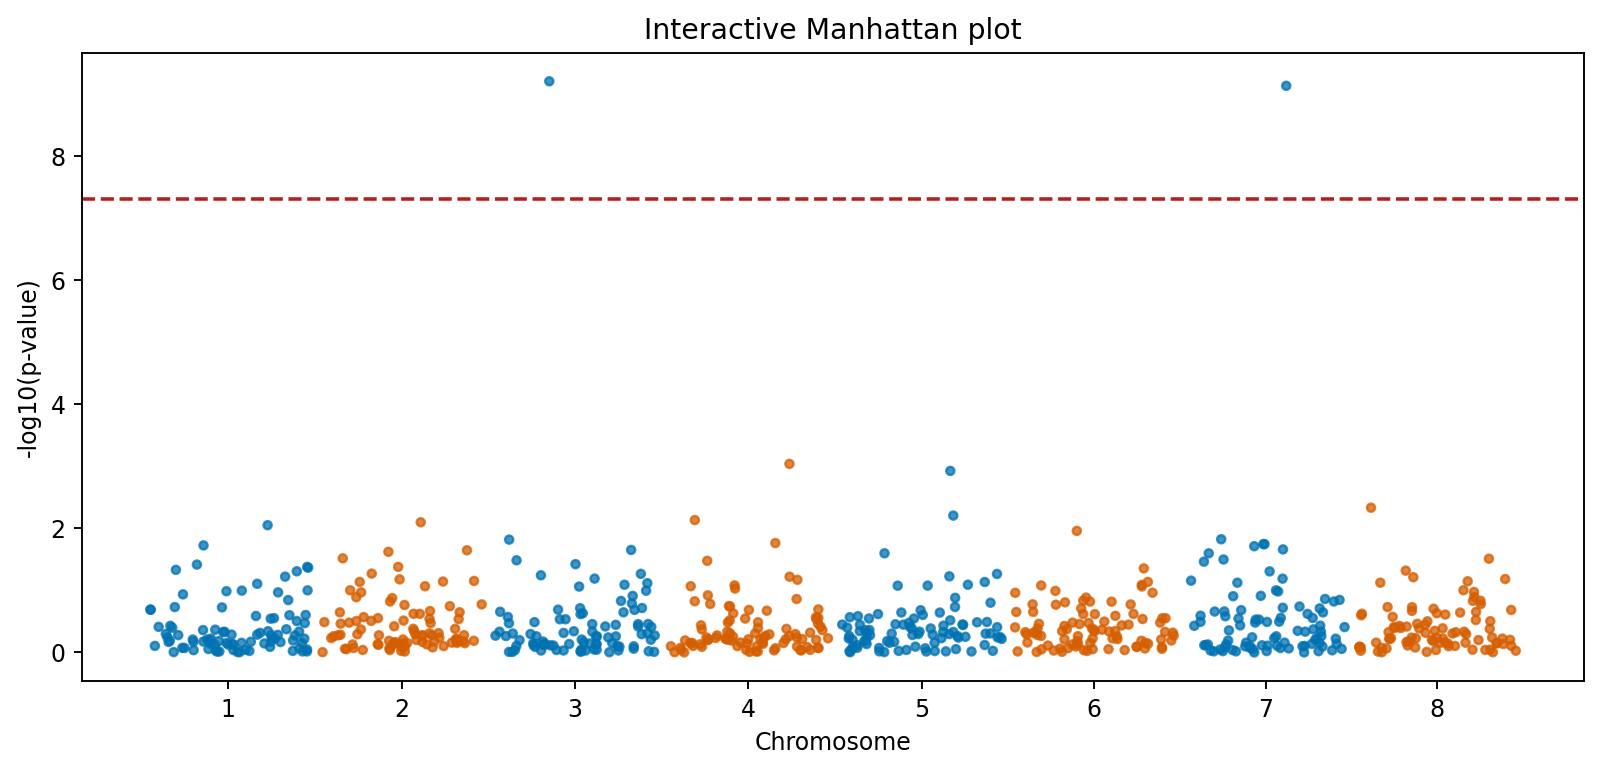
Chromosome coordinates are cumulative and the threshold is explicitly annotated.
Expression distributions
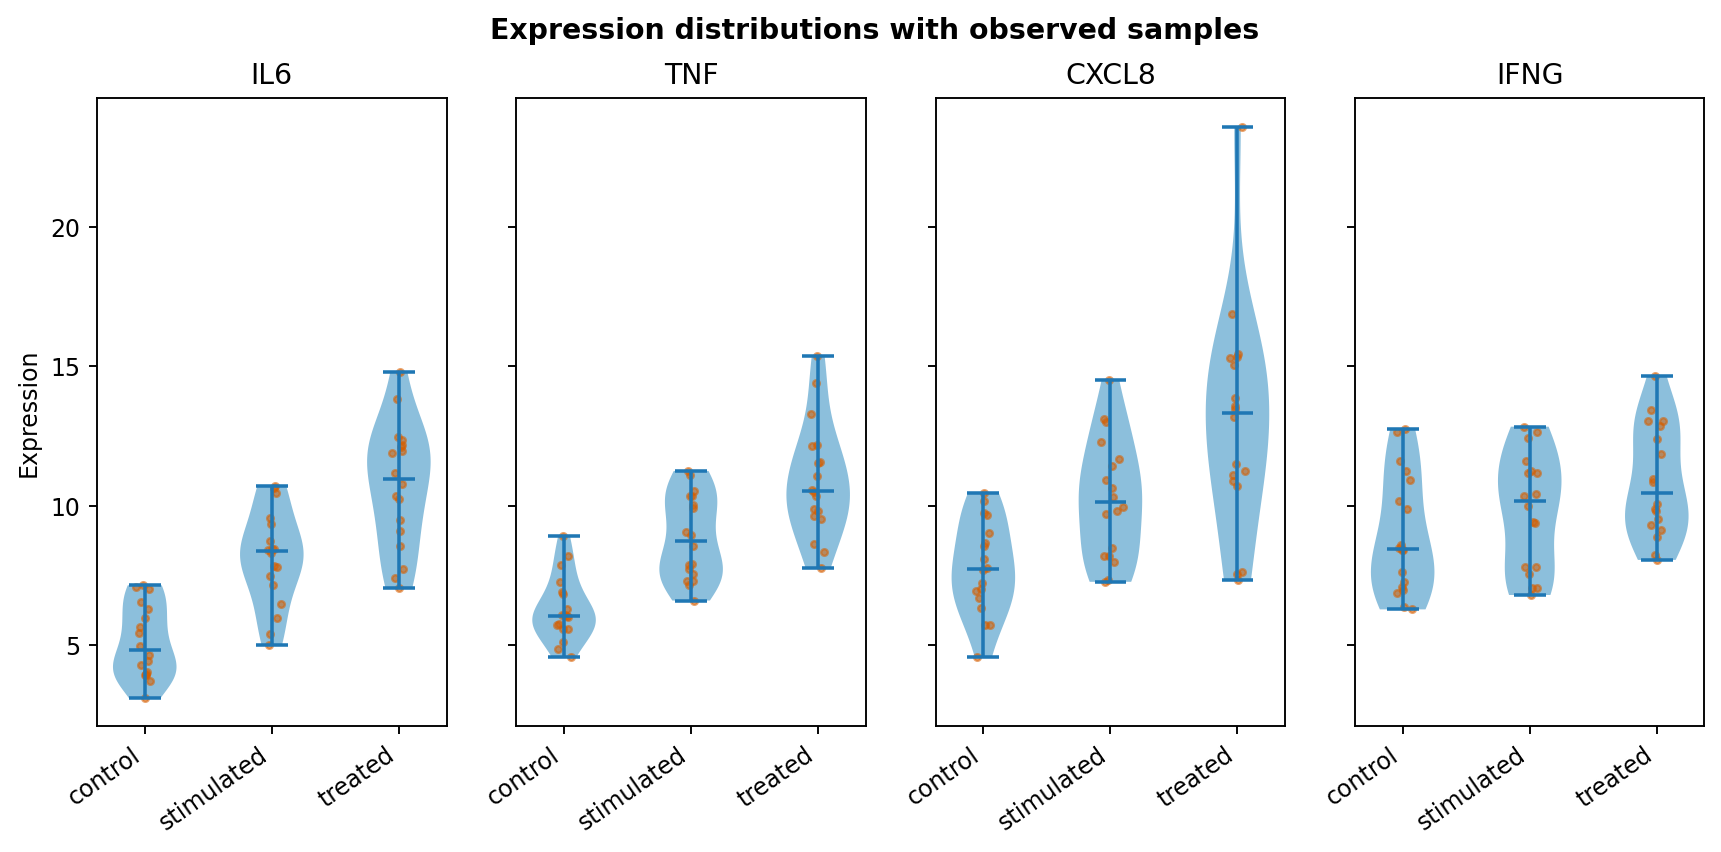
Violin, box, and observed-point layers prevent a summary-only interpretation.
Animated growth response
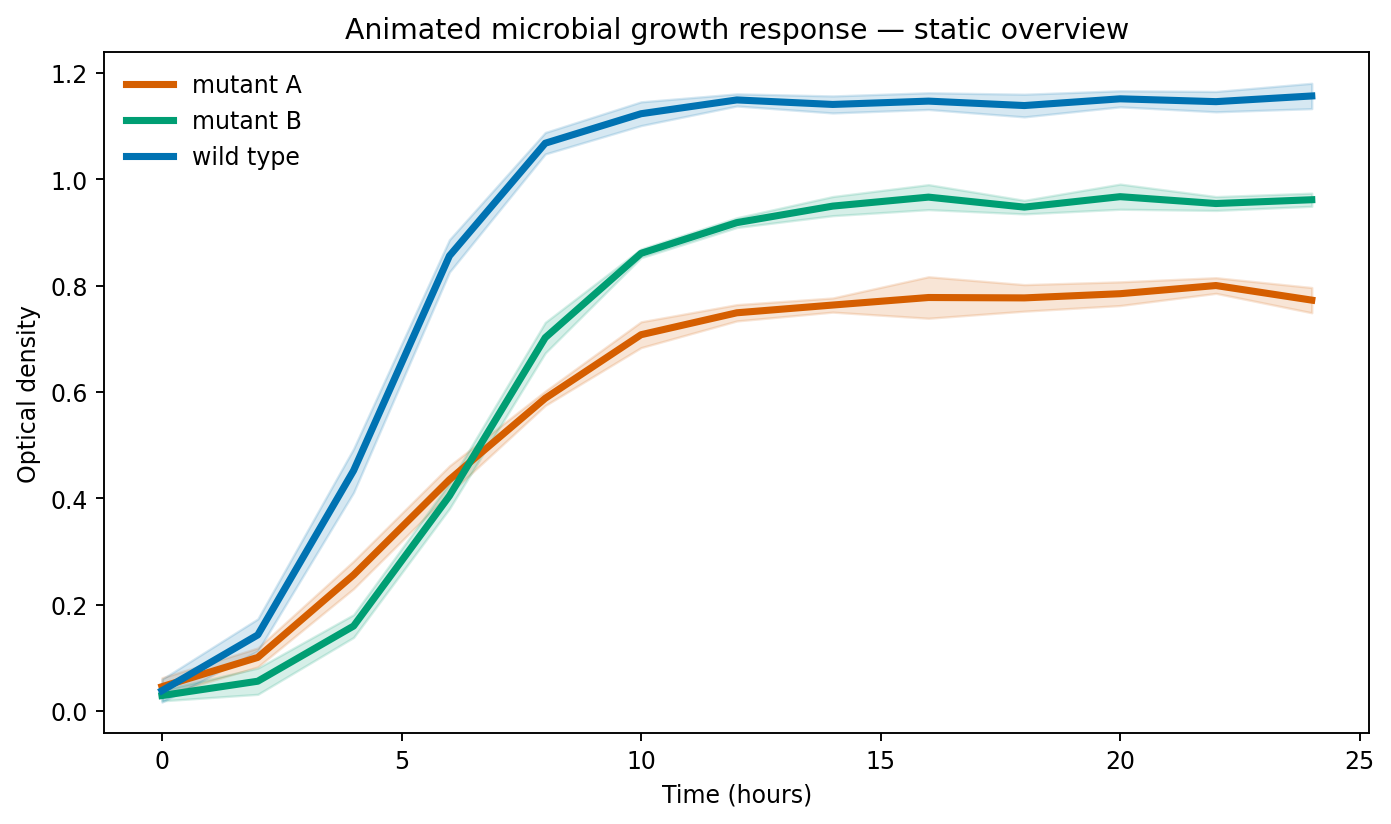
The interactive HTML contains a stable-axis animation through experimental time.
Pathway hierarchy
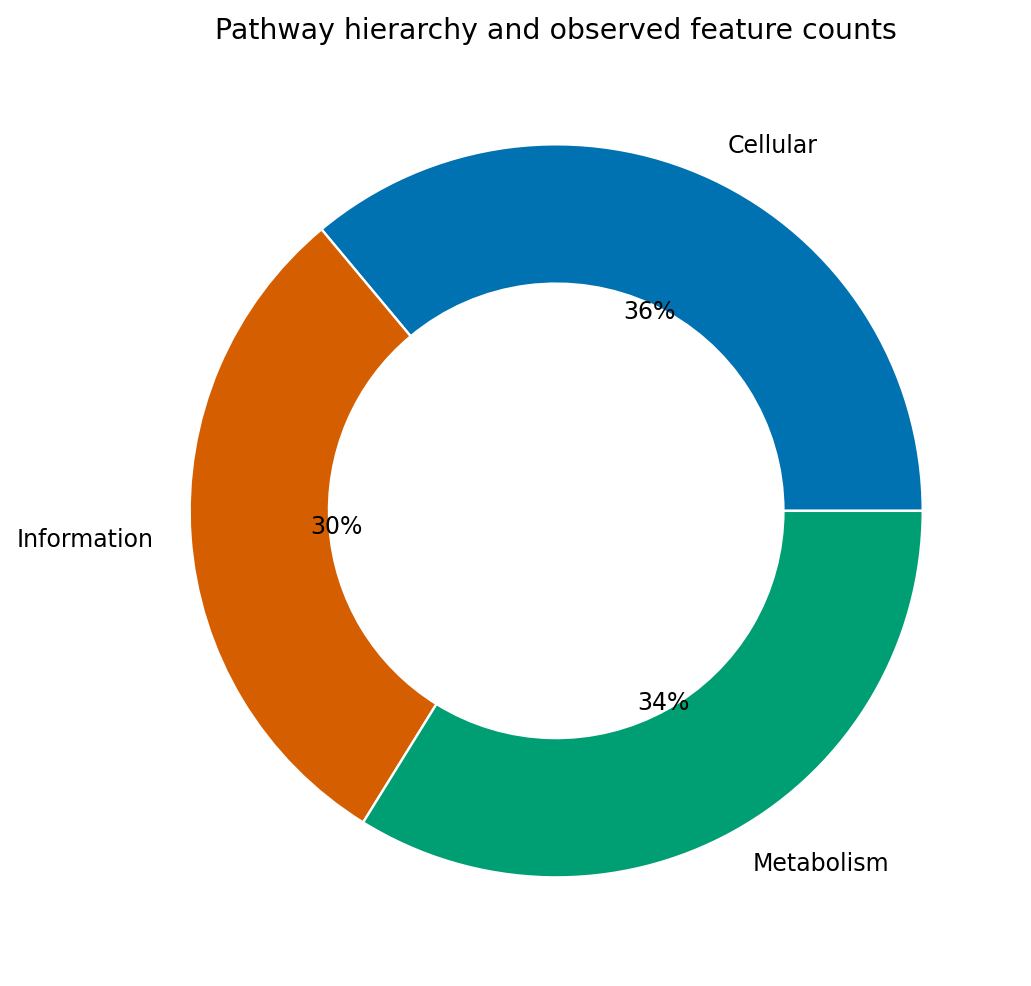
This is a hierarchy of observed counts, not a statistical enrichment analysis.